![tradable-bits-long-logo-for-download.png]](https://resources.tradablebits.com/hs-fs/hubfs/tradable-bits-long-logo-for-download.png?height=40&name=tradable-bits-long-logo-for-download.png)
The Ticket Stats reporting tool transforms your raw ticketing data into actionable audience insights. By applying custom filters, you can audit primary sales revenue, map out geographic buyer trends, and uncover unique fan correlations. Follow this guide step-by-step to configure, analyse, and share your data reports.
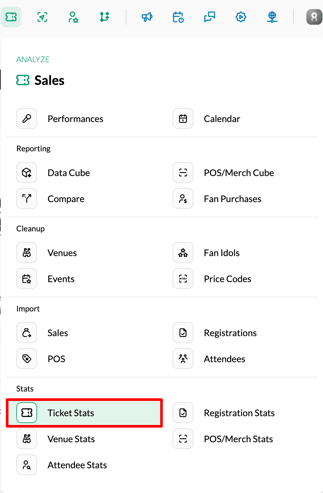
To get started, from your Tradable Bits Homepage, hover over the Top Navigation Bar and head to Sales > Stats > Ticket Stats.
A Quick Preface: We know that nothing is more daunting than a blank page. It’s okay, we’re here with you. To get situated before you start MacGyver-ing around, we recommend selecting a time period where you know you have data and just clicking the "Generate Sales Report" button.
Filtering your Results
- Event Name(s)
You can create a new event by navigating to Sales > Data Library > Events
- Venue
- Source
- Network
- Purchase Date
- Idol
- Ticket Type
- Season Name
Under the Advanced section, further segment your results by filtering by Event Date or excluding $0 purchases.
Step 2: Generate either a Sales Report or a Geo Report
Sales Report
This report calculates metrics based on original primary sales. Secondary market records and cancelled transactions are excluded to ensure accurate revenue and inventory auditing.
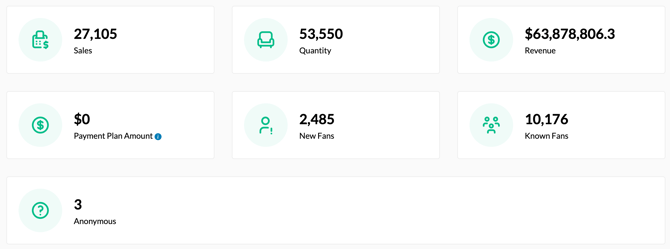
The report provides visibility into the following core metrics:
-
Total sales
-
Ticket quantity
-
Sales value (in CAD)
-
Total amount paid on payment plans
-
New fans who purchased tickets
- Known fans who purchased tickets
- Anonymous fans who purchased tickets
Visual & Data Breakdowns
-
Top 10 Events (Ticket Sales): A pie chart highlighting your top 10-performing events by ticket sales.
-
Sales Amount Graph: Compares the number of Tickets Sold, the 3-Day Average, and the 7-Day Average over your configured purchase timeframe.
- Sales by Date: A table view breaking down monthly performance, highlighted by Sales Value, Orders (Sales), and Items Purchased.
Note: The data is limited to the last 3000 days
- Events vs Performances: Compare multiple events side-by-side by Date, Fans, Tickets, and Generated Revenue.
Correlation Graph
This correlation graph helps you visualise the relationships between different metrics based on how many unique fans they share in common. Each point represents a metric, and the thickness of the connecting lines shows the size of the overlapping fan audience.
By default, the graph displays all metrics in your selected category, but you can choose to "centre" the view around a specific metric to isolate only its direct audience connections. Clicking any point opens a detailed summary of exact fan overlap numbers.
-
Metric Category: Choose between Venue Province, Event, Venue, or Artist Name.
-
Metric to Centre Around: Input a desired metric to isolate its specific audience connections (e.g., Metric Category: Artist Name | Metric to Centre Around: The Weeknd).
Before you get started: Make sure that the parameters of your search are not too “zeroed in” on a specific venue or event. You will not be able to pull a correlation graph that includes information outside your filter.
Each node represents one thing (i.e. if you view by artist name, each node will represent a unique artist). The lines between nodes represent correlations. The thicker the line, the more connections the two nodes share.
- Use your mouse to scroll and zoom in and out.
- Hone in on specific artists, events, venues or provinces by clicking on their nodes. You will get a list of their highest connections, ordered from most to least.
Note: The number of connections comes from a normalising algorithm using your account data; it represents relative overlap, NOT the raw number of tickets or fans sharing the two nodes.
Geographic Report
Sales Distribution Map
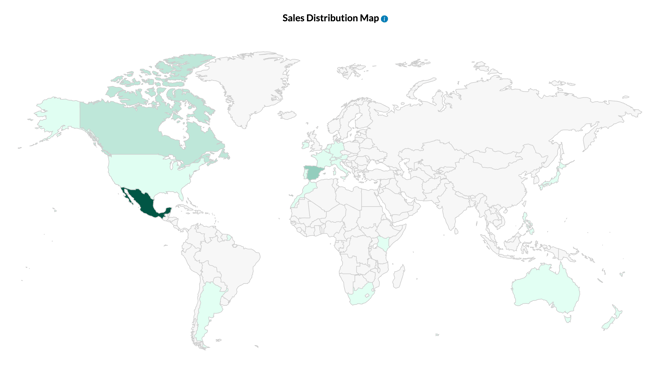
View sales by country and province/state. To get a closer look at your data, simply zoom in on the map and click on the specific country, state, or section you would like to see stats for. Once selected, hover your mouse over the individual regions to instantly view the total ticket sales for each area.
Geographic Sales Breakdown
- Sales Value (in CAD)
- Orders (Sales)
- Items Purchased
- Average Seats Per Sale
- Fans
Sharing

The generated report link allows anyone who receives it to view the report, even if they don't have a Tradable Bits account.
Still need assistance? Please reach out to your Customer Success Team or contact support@tradablebits.com