Use the reporting section to get high-level insights about your data & how it’s interconnected, while also understanding how your data is organised. Hone in on ticket analytics, find correlations between purchasers & affinity, compare sales between two promotional periods, and dive deeper into fan purchases.
Section 1: Performances
From your Tradable Bits Homepage, go to the Top Navigation Bar and hover your mouse over the Sales Icon and click on Performances.
Performances serve as the centralised home for your marketing initiatives. Think of a Performance as a "container" that allows you to group all the moving parts of a specific project—such as ads, trackers, and ticketed events—under a single, organised name.
How it Works:
-
Performance: Represents a single event or specific initiative (e.g., "2026 Season Loyalty Portal").
-
Performance Group: Represents the broader marketing strategy or a collection of events (e.g., "National Tour 2026").
Key Benefits:
-
Simplified Reporting: Keep all related ads and trackers organised for clear post-campaign analysis.
-
Automatic Tracking: Seamlessly connect with ticketed events to monitor conversion rates.
-
Holistic Data: View results at both the individual event level and as a collective Performance Group.
To begin tracking your impact, simply select “+New Performance” from your dashboard.
Common Use-Cases:
-
Managing Multi-Stop Events or Tours: When running a series of events, like a national tour or a multi-city season, a Performance Group acts as your master folder. This allows you to group individual cities or dates as separate Performances while seeing the bigger picture. For example, if you are running ads for a "National Basketball Tour," you can compare which city is converting fans the fastest and redistribute your budget to the regions that need more support.
-
Tracking Long-Term Loyalty Initiatives: Marketing isn't always about a single flash sale; it’s often about a long-term journey. You can use a Performance to group different phases of a campaign, such as a "2026 Membership Drive." By housing the initial "Early Bird" invite, the mid-season reminders, and the "Last Chance" SMS alerts in one container, you can see how the entire lifecycle of the initiative performed rather than looking at disconnected fragments of data.
Section 2: Reporting
Data Cube
Data what? The Data Cube is your all-encompassing tool to see all of your ticketing fields, including venue, price-code, date, source (i.e. where your purchasing information came from) and more.

Common Use-Cases:
-
You want to track on-site sales: Analyse the revenue generated specifically from merch tables or various points of sale at your event by filtering by Location.
-
You want to identify your "Hero" products: Filter by Product Name or Category to see which specific items (like jerseys vs. hats) are driving the most auxiliary revenue.
Check out our guide to Get Started With Data Cube
POS/Merch Cube
The POS/Merch Cube is your central hub for exploring and analysing purchase data across your connected commerce platforms, such as Shopify. By syncing your sales data, you gain a deep understanding of exactly what products your fans are buying and which networks are driving those sales.

Common Use-Cases:
-
You want to track on-site sales: Analyse the revenue generated specifically from merch tables or various points of sale at your event by filtering by Location.
-
You want to identify your "Hero" products: Filter by Product Name or Category to see which specific items (like jerseys vs. hats) are driving the most auxiliary revenue.
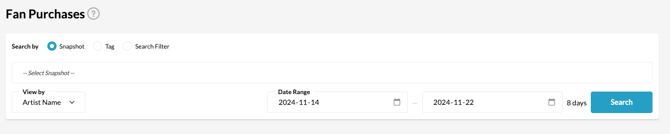
Fan Purchases
By combining audience segments with purchasing behaviour, you can move beyond general sales figures to understand exactly who is buying what, and how their behaviour changes over time.
Check out our guide to Get Started With Fan Purchases
Common Use-Cases:
-
You want to track the "graduation journey": Use Snapshots to see if fans who previously purchased General Admission tickets are now buying VIP or Premium price codes.
-
You want to measure campaign "stickiness": Filter by a specific Tag (e.g., fans from a recent contest) to see if those new leads are actually purchasing tickets to other events or if they were only interested in the giveaway.
Section 3: Cleanup
Venues
Venue Cleanup is your tool for maintaining a healthy and organised database. Inaccurate or duplicate venue names (e.g., "The Forum" vs. "Forum Melbourne") can fragment your data, making it difficult to get a clear picture of your sales. By cleansing your list and merging duplicates, you ensure that every purchase is matched to the correct location.
Check out our guide to Get Started With Venue Cleanup
Idols
Artist Cleanup is where you align the incoming purchase data from your ticketing partners with the "Idols" you have created on the Tradable Bits platform. Often, raw ticketing data contains variations or typos of an artist's name; this tool allows you to map those variations to a single, master Idol profile.
Check out our guide to Get Started With Artist Cleanup
Events
Event Cleanup is the primary tool for organising and refining the event data within your purchasing records. It allows you to fix missing information, merge duplicate entries, and ensure every ticket sale is linked to the correct event. By maintaining high-quality event data, you ensure your sales reporting is both accurate and easy to navigate.
Price Codes
Price Code Cleanup is the primary tool for categorising and refining the pricing data within your records. It allows you to standardise inconsistent naming conventions from different ticketing providers—such as merging "PrimoVIP" and "VIP-Platinum"—into a single, unified category. By mapping your source codes to specific target buckets, you ensure your sales reporting is consistent, accurate, and easy to navigate.
Check out our guide to Get Started With Price Codes Cleanup
Section 4: Import
Sales
Sales Import is the primary tool for connecting external purchasing and registration workflows to the Tradable Bits ecosystem. It allows you to manually upload historical or third-party data—such as ticketing, merchandise, or RFID records—via CSV files to ensure your FanCRM remains a comprehensive source of truth. By mapping your external data to Tradable Bits' mandatory fields, you unlock powerful insights into fan behaviour and ensure your cross-platform reporting is both robust and actionable.
Check out our guide to Get Started With Sales Import
Registrations
Registration Import is the primary tool for manually bringing fan sign-ups and registration data into your FanCRM. While most data flows automatically through integrations, this tool allows you to upload external or historical files—such as legacy registration lists or offline sign-ups—via CSV. By designating your spreadsheet data into pre-defined fields, you ensure that every fan profile is enriched with accurate registration history and ready for targeted engagement.
POS
POS Sales Import is the primary tool for incorporating merchandise and point-of-sale records into your reporting suite. This is particularly useful for providers that do not yet have a programmatic integration with Tradable Bits, allowing you to manually bridge the gap for a complete view of fan spending. By importing these records, you ensure that merch and POS transactions are fully searchable within the FanCRM, providing a 360-degree view of fan purchasing behaviour across all channels.
Attendees
Attendee Import is the primary tool for uploading scan data to track actual event participation. By importing these records, you can differentiate between ticket purchasers and those who physically attended, ensuring your reporting and fan insights reflect real-world presence.
Section 5: Stats
Stats is your primary area for uncovering high-level sales insights and tracking real-time performance. This section allows you to monitor day-by-day trends, compare growth between new and returning fans, and formulate data-backed strategies.
For a deeper dive into each tool, check out our guide on How to Interpret your Sales Stats to learn how to search and read your results for each specific section.
Ticket Stats
Ticket Stats is your primary dashboard for monitoring sales health and analysing fan purchasing behaviour. It allows you to track sales volume, identify trends over time, and distinguish between new, returning, and anonymous fans. By leveraging detailed filters like Venue, Source, and Season, you can generate data-backed reports to understand exactly who is buying your tickets and when.
Note: For accurate revenue and inventory auditing, the sales data here reflects only primary active ticket sales. Secondary sales data, meaning tickets that have been transferred, resold, refunded, or cancelled, are excluded.

-
Use Case: Compare the performance of "new" vs. "returning" fans during an on-sale period to determine if your marketing is reaching a fresh audience or re-engaging your loyal base.
Registration Stats
Registration Stats provides a focused view of fan sign-ups and non-purchase entries within a specific timeframe. This section is essential for measuring the growth of your database and the success of your registration-based campaigns. You can narrow your results by event name or venue to see which activations are driving the highest fan acquisition.
-
Use Case: Generate a report for "XFest" to see the total number of new registrations gathered during the week leading up to the event.
Venue Stats
Venue Stats allows you to analyse performance metrics across different locations and spaces. This section provides deep insights into venue-specific trends, including lifetime totals and the average number of seats sold per fan. It is a vital tool for assessing which venues are driving the most value and how seat density varies by location.
-
Use Case: Identify your highest-performing venues by comparing lifetime sales totals and average "seats per fan" to optimise future tour routing.
POS/Merch Stats
POS/Merch Stats is designed to track on-site spending and merchandise performance. This section allows you to break down revenue by product name, merchant, or specific location within a venue. By analysing these point-of-sale records, you gain a clearer picture of fan affinities and physical product demand, rounding out your 360-degree view of fan spend.
-
Use Case: Filter by "Product Name" after an event to see which specific merch items were the top sellers at the north-side booth versus the south-side booth.
Attendee Stats
Attendee Stats is designed to provide real-time visibility into how many fans are scanning into your events. By filtering by group, event, or venue, you can access a detailed chart that breaks down successful and failed scans across specific zones and group sets. This data allows you to monitor entry flow and venue capacity based on verified attendance records.
-
Use Case: Filter by "Zones" during an event to identify which venue entrances are experiencing the highest traffic or to review scan failure rates at specific gates for future logistical planning.
Now that you know exactly what you can do and have an idea of what insights you want to uncover, get started by pulling an analytics report.
For a more advanced look at your data, we recommend exploring Octane, our AI-driven reporting tool. Octane reduces hours of manual spreadsheet work into instant, actionable insights through flexible dashboards.
Still need assistance? Please reach out to your Customer Success Team or contact support@tradablebits.com