![tradable-bits-long-logo-for-download.png]](https://resources.tradablebits.com/hs-fs/hubfs/tradable-bits-long-logo-for-download.png?height=40&name=tradable-bits-long-logo-for-download.png)
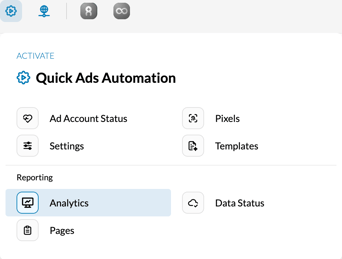
From the Tradable Bits Homepage, hover over the Top Navigation Bar and click through to Quick Ads Automations > Reporting > Analytics.
Step 1: Configure your report settings
- Date Range: Select the start and end dates for your performance timeframe.
- Analysis Template: Select a previously saved search query from the dropdown, or leave it set to load a new custom search.
- Conversions to Display: Choose All Conversions or Custom Conversions depending on your reporting focus.
- Manual Avg. Seats Per Sale: Input your average seats per sale.
Note: If you leave this field blank, we will calculate average seats per sale by venue. If you don't use venues, you will need to put in a manual average.
- Labels: Add specific campaign labels to filter your reporting data. Toggle Combine labels in table if you want grouped reporting.
Step 2: Choose Breakdowns & Values
-
Breakdowns (Up to 6 max): Select the rows you want to break your data down by (e.g., Group, Campaign, Artist, Venue, Creative Type, Audience Type).
-
Values: Select the specific metrics you want to display for each row (e.g., Ad Spend, Total Clicks, ROAS, Tickets, Conversion Value).
-
Data Filter (Optional): Click + Add Data Filter to exclude or include specific groups, templates, or pages.
Step 3: Generate or Save Your Report
- Click Generate to run your report immediately.
- Click Save Template at the bottom to store your current setup for future on-demand analysis.